The so-called ‘growth convergence’ literature posits that poorer economies will grow faster than richer ones and eventually catch up with them, but this is conditional on the presence of ‘fundamentals’ – good policies and inclusive institutions.
It will take Bangladesh more than 45 years to reach the current per capita real GDP of the USA, but in terms of life expectancy, a remarkable degree of convergence seems to have taken place.
Here are some pertinent numbers on life expectancy in the USA and Bangladesh
| Indicator | United States | Bangladesh | The Gap |
|---|---|---|---|
| 1960 Life Expectancy | 69.8 years | 44.0 years | 25.8 years |
| 2024 Life Expectancy | 79.8 years | 75.5 years | 4.3 years |
| 2024 Male Avg | 77.4 years | 73.8 years | 3.6 years |
| 2024 Female Avg | 82.2 years | 77.2 years | 5.0 years |
There are several states in the USA in which life expectancy is lower than in Bangladesh. See the table below.
Arkansas | South | 73.9 | |
| 45 | Oklahoma | South | 73.8 |
| 46 | Tennessee | South | 73.8 |
| 47 | Alabama | South | 73.8 |
| 48 | Louisiana | South | 73.8 |
| 49 | Kentucky | South | 73.6 |
| 50 | Mississippi | South | 72.6 |
| 51 | West Virginia | South | 72.2 |
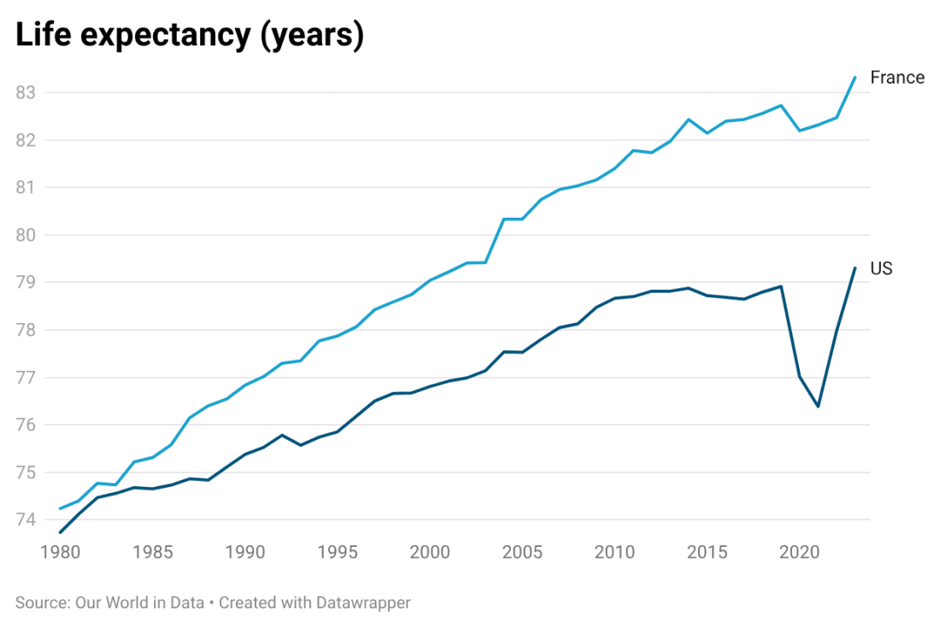
Life expectancy in the USA has diverged from trends in other rich nations. The figure below provides an example.
When one examines ‘healthy life expectancy’ (HALE), that is, the average number of years that a person can expect to be healthy, Bangladesh has apparently almost caught up with USA! See the table below.
| Indicator | Bangladesh | United States |
|---|---|---|
| Healthy Life Expectancy (HALE) at birth | 62.4 years (2023) | 64.6 years (2023) |
| Overall Life Expectancy at birth | 72.7 years (2023) | 78.5 years (2023) |
| Years spent living in poor health/disability | ~10.3 years | ~13.9 years |
How did this ‘longevity revolution’ in Bangladesh happen? A complex confluence of factors has led to this outcome. They are explored in a complementary commentary on my Substack platform.


