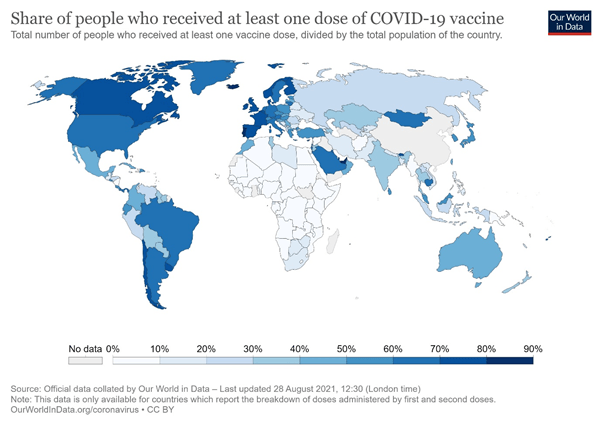
It widely known that the challenge of vaccine inequality (see Map above) impedes the ability of emerging and developing economies (EDEs) to cope with the pandemic and thus resume normal economic activity. As of today (September 15, 2021), 60.8% of the population in high income countries had at least one dose of available vaccines, while only a little over 3% of the population in low-income countries had one dose. It would take a massive – and unaffordable – increase of 57% of health-care spending for low-income countries to inoculate 70% of the population against COVID-19. In contrast, advanced economies will only need to increase 0.8% of health-care spending to reach the same target.[1]
Given this grim challenge, the IMF – in conjunction with other international agencies – has recently (June, 2021) proposed the provision of a USD 50 billion plan to vaccinate at least 60% of the world’s population and complement the global vaccination program with relevant COVID-safe health measures. No concrete actions have been taken so far.
The announcement by the IMF of the largest allocation of special drawing rights (SDRs) amounting to USD 650 billion in August, 2021 might be one way to support the USD 50 billion-dollar plan. Yet, critics are concerned that the new SDRs might raise a lot of expectations without fulfilling them. This is because SDRs – in line with line with long-standing practice – will be distributed to countries in line with a country’s quota share with the IMF. Given that EDEs are ‘minority’ shareholders, it is not surprising that EDEs as a whole are expected to get 42% of SDRs, while low-income countries are likely to get 3.2% of the new SDRs.[2] In some cases, even this modest amount might be a lot as a share of the GDP of low-income countries, but this might still fall short of their spending needs. On the other hand, advanced economies that do not really seem to have financial constraints in dealing with the pandemic, will have significant shares of SDRs which they might not be prepared to recycle to the poorer parts of the world. Hence, a proposal has been made that a COVID-19 trust be set up to recycle the SDRs as well as transfer them to the regional development banks (Eichengreen, 2021). Whether this will happen remains to be seen.
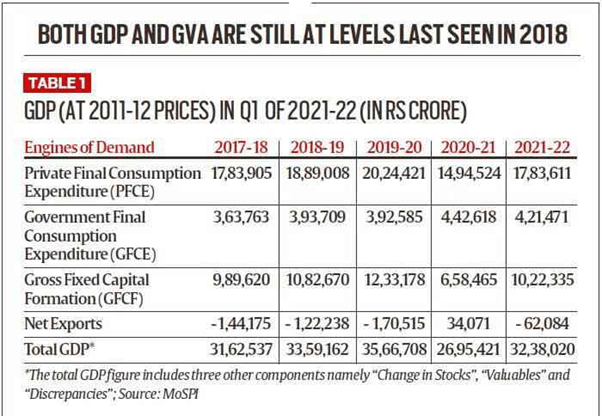
There is the long-term development challenge of attaining and financing the SDGs. Even in the pre-COVID-era, there was a USD 2.5 trillion financing gap which, as a result of COVID-19, has increased to USD 4.2 trillion (OECD, 2021). This has occurred against a background of modest trends in national tax revenues of EDEs as well as aggregate trends in external finance – see Figure 1 below. Hence, as the international community approaches 2030, the key fiscal policy will revolve around finding sustainable means of resource mobilization to reduce the SDG financing gap.
Figure 1

[1] These statistics are available at https://data.undp.org/vaccine-equity/
[2] These figures are based on data provided by the IMF (https://blogs.imf.org/2021/08/26/a-shot-in-the-arm-how-special-drawing-rights-can-help-struggling-countries.)