Trump tariffs and the US-China trade war

Source: Financial Times

President Trump and his loyalists are true believers in the omnipotence of tariffs. They believe such taxes on imports will deliver economic nirvana to Americans. Tariff-jumping companies – both of US parentage and beyond – will return to US shores to jump-start manufacturing and create much-needed jobs, especially for the residents of the American ‘red states’.  Revenues from higher tariffs will fill the coffers of the Treasury enabling Trump to engage in pork-barrelling and funding pro-rich tax cuts.

Trump and his acolytes despise bilateral trade deficits. Such deficits reflect an underlying malaise: tthe rest of the world is allegedly ‘ripping off’ the US. Hence, the idea is to ‘carpet bomb’ hundreds of countries with punitive tariffs with China becoming a particular target of opprobrium. The global effective tariff rate is now the highest in the world since the turn of the 20th century.

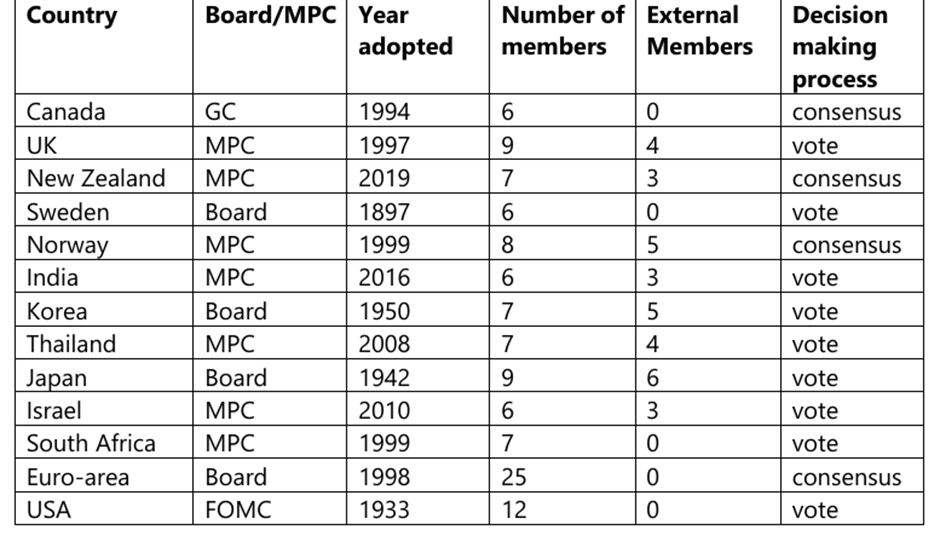
While countries such as Vietnam have capitulated by offering to implement zero tariffs on American goods and services, and while some long-term allies, such as Australia, have offered no retaliation, China has taken a different approach. It has engaged in an active trade war with the USA by imposing retaliatory tariffs – see Exhibit 1 – and has announced complementary restrictions on American companies doing business with China.

Exhibit 1

Source: New York Times, 11 April, 2025

Which party will prevail in this clash of two titans of global commerce? To start with, Trump has blinked, despite his asinine proclamation that various countries of the world are prepared to ‘kiss his ass’. (warning: distasteful video content). He has been humbled by developments in global financial and bond markets. Stock market prices have declined sharply in response to the Trump tariffs. More importantly, one detects a restive bond market with returns on long-term US Treasury bonds rising sharply to 5 percent.

This has ominous implications for US borrowing costs as well as the cost of financing sovereign bonds in other parts of the world. Trump was forced to engage in strategic retreat by imposing a ’90 day’ pause on tariffs worldwide with the conspicuous exception of China. But…the Chinese authorities must have noted, in common with others across the world, that Trump’s seemingly invincible aura has been tarnished.  

Furthermore, many of the supposed benefits of the Trump tariffs represent wishful thinking rather than a pragmatic assessment of likely outcomes. Thus, the idea of tariff-jumping companies relocating to the USA is far-fetched, given that this is a process that takes time and relies on a predictable tariff regime. Trump has shown that the trajectory of tariffs under his regime will be highly erratic shifting with shifting economic and political circumstances.

The notion that tariffs will yield a revenue bonanza for the US government also ignores empirical regularities. Many decades ago, economist Arthur Laffer discovered the Laffer curve on the tax-revenue relationship: very low taxes lead to very low revenue collection, but very high taxes also have the same result. The Laffer curve is valid for the tariff-revenue relationship as well. At current prohibitive rates, the Trump tariffs are unlikely to yield a revenue bonanza – see Exhibit 2 – as the ‘volume effect’ of import compression will more than likely offset the ‘value effect’ of higher import duties.

Exhibit 2

Source: https://asiatimes.com/2025/03/tariffs-have-a-laffer-curve-too/

Once again, the Chinese authorities are likely to conclude that the incidence of the Laffer curve will prevent the Trump administration from building a war chest that it can draw on in its trade war with China.

Other factors at play put China at a strategic advantage vis-a-vis the USA.

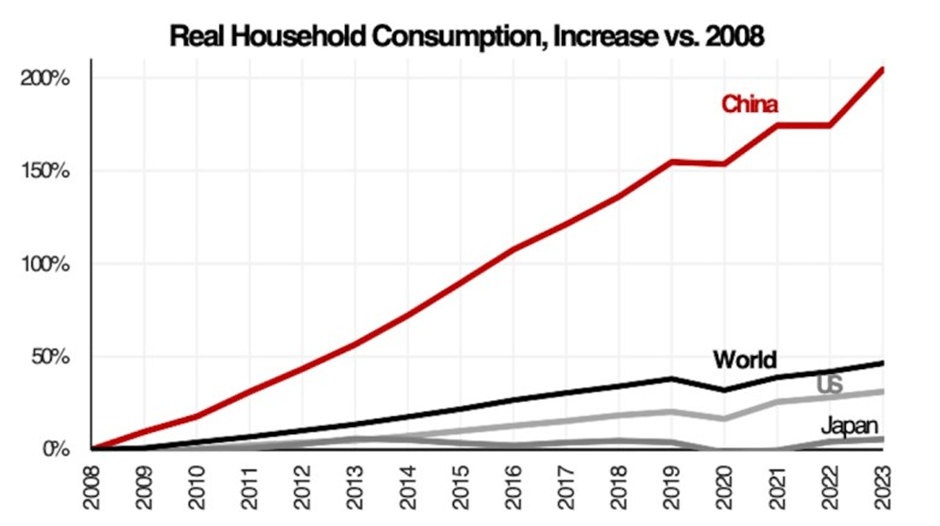
China is no longer a country populated by ‘peasants’ as the American Vice President JD Vance would like to believe. It is now at the forefront of new technologies, ranging across renewable energy, electric cars, robotics, and AI. It no longer relies on cheap imports flooding the US market. Thus, China has undertaken both product and market diversification of its exports. In any case, China has a vast domestic market in which consumption growth is now the highest in the world led by millions of millenials – see Exhibit 3a. This deflates the oft-noted view that the overly centralized Chinese economic system over-invests and under-consumes. China is certainly politically centralized, but this is combined with a radically decentralized economic system that operates at the mayoral level. This is the ‘new China playbook’. (see Exhibit 3b)

Exhibit 3a and 3bConsumption growth and the new China playbook

China also has a tight grip on rare earth minerals that are critical to the US tech and defense industries. One must not forget too that Elon Musk – the richest man in the world and one of Trump’s main supporters – has heavily invested in China to produce and export Tesla EVs. China, if it really wanted to be mean-spirited, could exploit these US-specific vulnerabilities.

China, as Mahbubani often points out, is the ‘oldest continuous civilization’. Deeply held notions of national humiliation by Western powers in the past (1840-1949) have shaped China’s outlook on contemporary international relations. A civilization is unlikely to be upstaged by an upstart Western power.

One should not, of course, paint a rosy picture in which China wins, and the USA loses in this trade war. Both countries will have bloody noses and will suffer a great deal of pain, as the Yale Budget Lab points out. Other model-driven estimates suggest that the USA will suffer more socio-economic losses relative to China – see Exhibit 4.

Exhibit 4

A US-China trade war will unfortunately impose considerable collateral damage to the rest of the world. Low- and middle-income countries are likely to suffer the most and will become the victims of this US-led, self-inflicted damage to a rules-based global trading system. Even worse, the putative trade war could lead to a catastrophic conflict on a global scale.

The governance of central banks and monetary policy committees: are they too narrowly constructed?

A modern central bank usually relies on ‘monetary policy committees’ or MPCs (albeit with different names, such as boards and councils) that play a pivotal role in the conduct of monetary policy. The collective deliberations of the MPCs are held regularly throughout the year and are geared towards recommendations (either by vote or consensus) on the setting of the policy rate.

The core principle is that the practice of monetary policy – and hence the role of the MPCs – should be free of political pressure. Central banks should be accountable but have operational independence in pursuit of their primary goal of maintaining price stability.

The size of the MPCs and the decision-making structure varies across countries and regions as shown below (Table 1). The MPCs are dominated by internal bank staff and economists, and, in some cases, with representatives from the corporate world. There are also cases in which there are no external members. There is no scope for representatives of workers and employers and representatives from civil society to be part of the membership of MPCs.  

Table 1: Composition of MPCs, selected central banks

Source: https://rbareview.gov.au/sites/rbareview.gov.au/files/2023-04/rbareview-paper-gai.pdf

The degree of gender parity is low in a typical MPC. India is a conspicuous example – see Exhibit 1. Would improving gender parity improve the quality of monetary policy as measured in terms of maintaining price stability? Research findings on this are ambivalent, but the aim is to use an august institution to promote gender equality which is a core element of the global development agenda.

Exhibit 1: Where have all the women gone? The Governor of the Reserve Bank of India meets with members of the MPC

Despite the restrictions placed on central banks that restrain them from broad-based community-level engagement, these entities have tried to overcome such restraints by a transparent communications strategy in which deliberations of MPCs are made public. Furthermore, in recent years central banks have moved away from a preoccupation with price and financial stability. One important example of this trend is a new form of engagement via international cooperation among central banks, most notably supporting climate action as a key aspect of monetary policy. This is best illustrated by the ‘Network for Greening the Financial System’ (NGFS) which now has 134 members.

Financial inclusion is another way in which central banks are changing their engagement with workers and employers and the broader community. As is well known, the aim of financial inclusion is to incorporate the unbanked segment of the population – which can be quite large in developing countries – into the formal financial system. A 2024 meta-analytical assessment shows that ‘…financial inclusion outcomes reflect small, positive and statistically significant average effects on consumption, income, asset and other poverty-related indicators. Given this finding, it is noteworthy to point out that the ‘Alliance for Financial Inclusion’ reports that there are now 84 central banks across the world that have formally integrated financial inclusion in their mandates.

Financial inclusion creates synergies between monetary policy and poverty reduction strategies as well as the agenda of transition to formality. Central banks have discovered that financial inclusion, by encouraging formalization, improves the monetary transmission mechanism and thus strengthens the effectiveness of monetary policy. This in turn creates the space for workers and employers as well as civil society at the domestic level to engage with monetary authorities in areas that go beyond price stability.

American pessimism: is it rooted in reality?

Americans are pessimistic about the future and foresee a nation in decline as as a Pew Research survey highlighted in 2023 (Figure 1). The American Psychological Association, in its 2024 survey, released only a few ago, reports that 77% of responds suffer from stress because of their bleak assessment of the nation’s future (Figure 2)

Figure 1: Majority of Americans foresee a bleak future….

Source: https://www.pewresearch.org/short-reads/2023/04/24/americans-take-a-dim-view-of-the-nations-future-look-more-positively-at-the-past/

Figure 2: For majority of Americans, the future of the nation is the primary source of stress

Source: https://www.apa.org/news/press/releases/2024/10/top-us-stressors

Are these grim perceptions rooted in reality? Boosters of American capitalism, such as the ‘sponsored’ media, will beg to differ. They will claim that America remains – and will continue to remain – among the most powerful and richest nations in the world. Are the boosters of American capitalism correct or has the average American got it right? Let us briefly examine long-term trends in per capita income, poverty and inequality in USA as a way of offering a data-driven perspective on this contentious topic.

Per capita real disposable income has grown steadily since 1990 (Figure 3), but within this positive and broad trend there are some troubling signs. While per capita real disposable income recovered from the trough of the COVID-19 recession, living standards today (2024) are lower than a few years ago.

One feature of Figure 1 is worth highlighting. The US economy has suffered nine recessions since 1950 (note the shaded areas in the figure representing US recessions.) Every time a recession takes place, average living standards take a hit as job opportunities shrink and unemployment rises.

Figure 3: Rising per capita income, but is lower today (2024) than a few years ago

Source: https://fred.stlouisfed.org/

What about trends in poverty? These are shown in Figure 4. There have been periods of sharp rises in poverty followed by impressive declines. The 2020 COVID-19 recession saw a surge poverty followed by a decline. Yet, the poverty rate in 2022 is still higher than it was in 2000.

Figure 4: Long-term trends in poverty

Source: https://fred.stlouisfed.org/

As is well known, the Achilles heel of US society is its high and rising levels of inequality, both in terms of income and wealth. These are shown in Figure 5 and 6. Perhaps these trends help to explain why 80% of Americans feel that the gap between the rich and the poor will widen.

Figure 5: Growing income inequality (as measured by the Gini index)

Source: https://fred.stlouisfed.org/

Figure 6: Rising wealth inequality since 1980 (share of top 1%)

Source: https://wid.world/country/usa/

It seems that the average American knows deep down what ails American society. It appears that it is the Trump vs Harris campaign surrounding the imminent US Presidential election (November 5, 2024) that is disconnected from reality. There has been no meaningful national conversations led by the Presidential candidates on how to respond to the challenges of deep-rooted poverty and inequality in the United States of America.

Counting the missing billions: taking care when reporting on money laundering

In reporting on financial and economic statistics, it is important to distinguish between stocks and flows as well relative and absolute numbers. Stocks (accumulated value of a variable over a given period) typically catches public attention in a way that annualised data usually do not. Similarly, relative figures usually turn out to be a lot more modest than absolute numbers.  I will illustrate these points by drawing on the Bangladesh experience.

In Bangladesh, media reports conflate typically stocks and flows. The currently popular citation is that US$ 150 billion has been siphoned off to various overseas havens by politically connected individuals over the last 15 years. Some media reports proceed to express stock estimates of money laundering as a proportion of flow data (annual GDP).  This can befuddle the lay reader.

The task of tracking money laundering falls on the Bangladesh Financial Intelligence Unit (BFIU).  I suspect, it is a small, under-resourced unit within the Bangladesh Bank (the best talent and resources probably go to units dealing with monetary policy). This does not make BFIU estimates less reliable than other estimates, but alternative estimates of annual rates of money laundering do exist and they ought to be acknowledged in public discourse. Transparency International Bangladesh (TIB) in the recent past has come up with an annualised figure of USD 3 billion, while the Washington-based Global Financial Integrity Institute (GFI) reported annualised figures of USD 8.7 billion. They note that most money laundering activities occur through trade mis-invoicing. One should not also overlook the use of the humble, but time-honoured, Hundi, as a source of money laundering. The bank heist by one of Bangladesh’s richest men is sensational but not a very common source of money laundering.

I personally prefer the use of annualised figure because they are easy to compare over time and across countries. Also, stock estimates can be made to assume astronomical magnitudes. For example, I understand that some Bangladeshi economists have come up with a stock estimate of money laundering for the 1972-2022 period. This understandably dwarfs the size of money laundering that are being reported now.

There is the issue of relative vs absolute numbers. Annualised data on money laundering can be expressed as a proportion of a country’s GDP. This is what the UN does. Another advantage is that this relative number offers an indication of the potential output loss from money laundering. In the case Bangladesh, a back-of-the envelope estimate (which is based on the annualised estimate of USD150 billion) suggests that it is 3.2% of GDP. The global norm ranges between 2-5% of GDP.

Has the incidence of money laundering has gotten worse over time? Here, the changes in country-specific ranking anchored in an ‘anti-money laundering index’ for 152 countries by a Swiss organisation, can be useful (1= worst, 152= best). BD ranked 82 in 2017, but then fell below 40 in later years before recovering to 46 in 2023. Why this has happened merits further investigation.

Finally, it is worth noting that, however measured, money laundering represents massive waste of resources enriching some at the expense of poorer nations. To be resolved, it needs global cooperation. Why is it that Singapore and London, for example, allow themselves to become havens for laundered funds? Indeed, London has been described as …’the main nerve centre of the darker global offshore system that hides and guards the world’s stolen wealth’. If the authorities there camp down on such havens (which they can), the incentive to park illicit funds abroad by crooks and criminals from developing countries will be significantly diminished.

.’