Offers succinct commentary on topical issues that cut across both rich and poor countries. Entails critical insights on poverty, inequality, health, macro-policies and many more
In a typically insightful piece, leading MIT economist Daren Acemoglu (he of the ‘Why nations fail’ fame), has cautioned his readers that widening inequality – or lack of ‘shared growth’ – will be the major challenge to crafting an inclusive digital future. This is because automation, shaped by the rising market power of a few very successful tech companies and the current global policy environment, has turned out to be one of the forces fostering greater inequality. Epithets such as the ‘digital divide’ captures these concerns, but there is more to this than just unequal access to digital infrastructure.
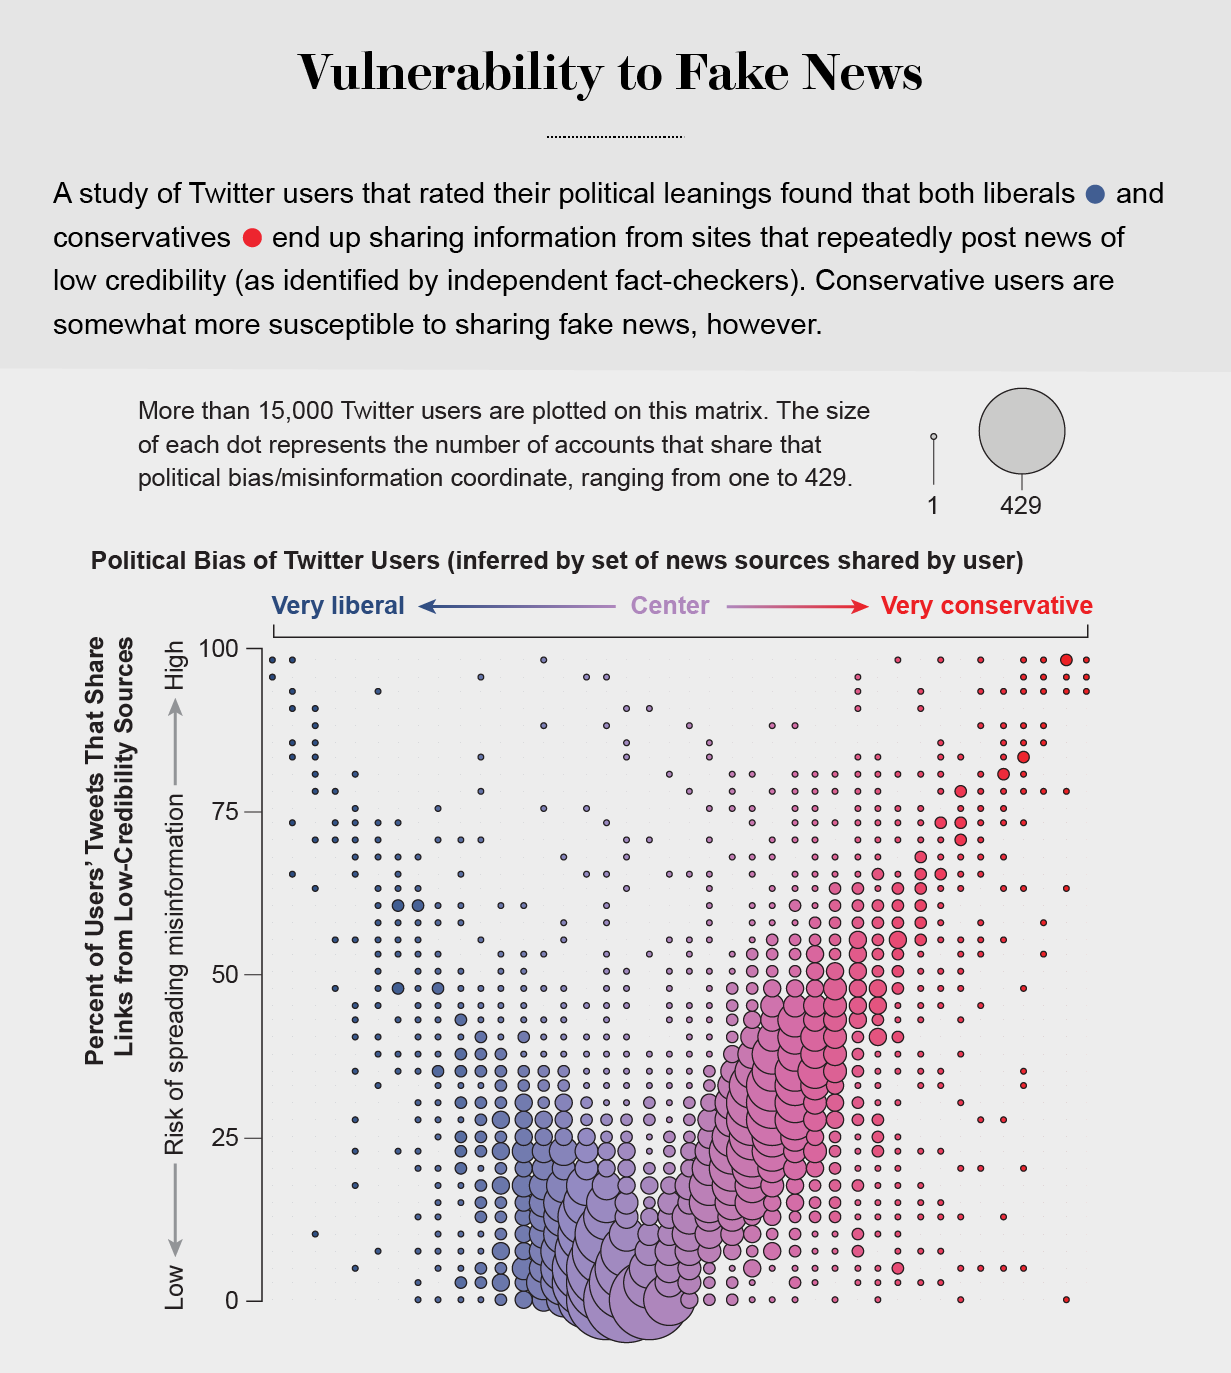
Defining automation as ‘…the substitution of machines and algorithms for tasks previously performed by labour’, Acemoglu notes that this process has unfolded throughout history. While there have been job losses, new technology has harnessed sustained improvements in human productivity and engendered new employment opportunities. Yet, this beneficial process can no longer be taken for granted. To start with, a few tech giants, such as Amazon, Alibaba, Alphabet, Facebook and Netflix, are responsible for 66 percent of global expenditure on machine learning and artificial intelligence (AI). They set the agenda on automation which, while privately profitable, is socially suboptimal. Second, the prevailing US-led policy environment has reinforced this misguided agenda. Current estimates suggest that, in the USA, investments in software and equipment are taxed at an effective rate of 5 percent and, in some cases, benefit from net subsidies. On the other hand, labour income is taxed at an effective rate of more than 25 per cent. Such distorted factor prices, combined with the systematic weakening of the bargaining power of organized labour and the dilution of the social welfare state, has led to the baleful configuration of a dearth of good jobs, precarious working conditions and ‘excessive automation’. At the same time, the rise of ‘AI-powered social media’ has incubated disinformation and conspiracy theories on a large scale (see Figure 1 below), as current and recent events have shown. This has fuelled social discord and a weakening of democratic discourse.
These unfortunate developments are not destined to happen. One cannot simply wish them away as the inevitable price of prosperity that a digital future is supposed to engender. One would need a shared global agenda in which there is a determined effort to attenuate distorted factor prices – which is why the effort by US Treasury Secretary (Janet Yellen) to aim for a common, cross-national approach to corporate taxation is so important. It is also necessary to temper the collective market power of a few tech giants, boost the bargaining power of organized labour, invest in the social welfare state and attenuate the digital divide.
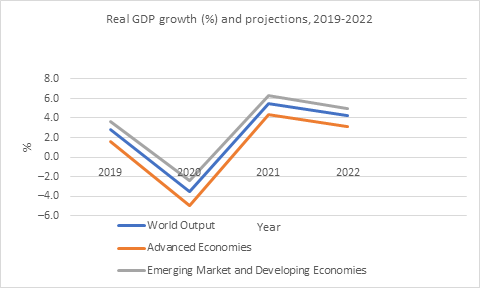
The latest (January 2021) IMF estimates reveal that world GDP for 2020 is expected to fall by 3.5 percent, with the advanced economies registering a projected decline of 4.9 percent. Emerging and developing economies are estimated to endure a fall in real GDP of 2.4 percent (Figure 1). This is unlike the last global recession of 2008 when the emerging and developing economies registered modest positive growth juxtaposed with a significant decline of more than 3 percent for the advanced economies. The net impact was that, at the global level, output contracted by a modest 0.1 percent.
Figure 1
Source: Derived from IMF, World Economic Outlook, January 2021
A ‘V’ shaped recovery is expected in 2021 across the world and the projections suggest that between 2020 and 2025 both the advanced and emerging and developing economies will continue to grow at a steady pace in line with recent historical trends (IMF data mapper, October 2020). Such a salutary outcome, however, rests on the critical assumption that appropriate policy responses across the world will be enacted and implemented and that the timely availability of vaccines will offer durable protection against the current pandemic. In the absence of appropriate policy interventions, much more pessimistic interpretations of the nature of the global economic recovery are very likely. This point is elucidated below.
A number of analysts have highlighted the notion that aggregate growth statistics hide the fact that a ‘K-shaped’ or uneven recovery is in progress.[1] This can be gauged from both sectoral growth and employment patterns and the nature of job losses across cohorts of workers stratified by income and skill levels.
The ILO’s latest Global Monitor (January 2021) notes that specific sectors, most notably, ‘accommodation and food services, arts and culture, retail, and construction’, have experienced massive job losses, while positive job growth is evident in information and communication, and financial and insurance activities which tend to be populated by higher skilled workers. Others find that the semiconductor industry is booming, while contact-intensive, service-oriented industries are languishing.[2]
Evidence from the USA highlights a striking pattern: high wage workers experienced job gains (+2.9 percent) during the pandemic, middle wage workers experienced modest job losses (-3.4 percent), while low wage workers experienced massive job losses (-21 percent).[3] This implies that COVID-19 is likely to exacerbate existing inequalities unless countervailing policy measures are undertaken.
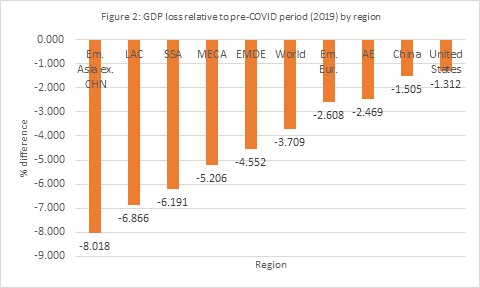
The thesis of uneven economic recovery also pertains to the fact that emerging and developing economies are likely to fare worse than advanced economies, despite GDP projections suggesting that the magnitude of the 2020 recession was less acute for low-and middle-income countries (Figure 1). This can be illustrated by computing GDP losses relative to the pre-COVID era (2019) across regions of the world (Figure 2). With the exception of China, in all cases, regions that form part of emerging and developing economies are expected to experience higher GDP losses relative to advanced economies.
Source: Derived from IMF, World Economic Outlook, January 2021
Notes: Em. Asia ex.CHN= Emerging Asia excluding China; LAC= Latin America and the Caribbean; MECA= Middle East and Central Asia (MECA); Em.Eur = Emerging Europe; AE= Advanced economies
Labour market indicators suggest that lower middle-income economies are expected to experience a greater degree of labour market distress relative to their counterparts in both rich and poor countries. The latest (January 2021) ILO estimates indicate that work-place closures have led to a loss of 8.8 percent of workhours globally relative to 2019 thresholds in 2020. This is distributed as follows: low-income countries – 6.7 percent; lower middle-income economies- 11.3 percent; upper middle-income countries: 7.3 percent; high income countries – 8.3 percent. Similarly, the share of labour income losses due to workhour losses are of greater magnitude in lower middle-income countries relative to their counterparts in low, upper middle-income and high-income countries.
If one adds the impact on extreme poverty of COVID-19, then the picture of the greater distress experienced by low- and middle-income economies becomes even more stark. Given the way that extreme poverty is currently measured (the ‘global’ poor earn less than USD 1.90 a day), it is almost exclusively prevalent in low- and middle-income economies. Until COVID-19, extreme poverty was on a sustained downward trend. Now, the latest estimates suggest that “… between 119 and 124 additional poor globally ” as a result of the pandemic (Lakner et al, 2021). What is worrying is the steady manner in which the pertinent projections have worsened. In April 2020, for example, the maximum expected increase in global poverty was 62 million. By January 2021, this has more than doubled.[4] Some of the most populous countries in South Asia, such as India, are projected to experience the highest increase in poverty (Kharas, 2020). In contrast, in some advanced economies, such as the USA, a generous, but time-bound, increase in income support was associated with stability in short-run poverty during the early phase of the pandemic.
One area that has been badly hit is the education of children and young adults. In April, when the first wave of COVID-19 was at its peak, more than 90 percent of children were subjected to school closures globally. At the same time, various tertiary institutions, most notably technical and vocational institutions, were badly affected. While the situation has eased to some extent, the deleterious long-term consequences are increasingly becoming evident. World Bank estimates note that ‘learning poverty’ (inability to read a simple text by age 10) is projected to increase from 53 percent of the pertinent cohort to 63 percent in low and middle-income economies. This in turn translates into potential earning losses almost equal to 10 percent of the collective GDP of middle-income economies.
In sum, the challenges that low and middle-income economies will face in a post-COVID world are immense. It will require a combination of national determination and generous international cooperation to attenuate these challenges.
I wrote a paper for the Griffith Asia Institute on the theme of COVID-19 and the challenge of meeting the SDGs in developing Asia. The paper is available here .
Nobel Laureate Paul Romer had a brief, but tempestuous, tenure at the World Bank as its Chief Economist. He reportedly had a tense and adversarial relationship with Bank staff on multiple issues, but the proverbial straw that broke the camel’s back turned out to be Romer’s critique of the World Bank’s celebrated Doing Business reports (henceforth DBR). He made an abrupt exit in January 2018 after this critique became public. Even worse, media reports attributed to him the sensational claim that Bank staff fabricated the data to create an unfavourable impression of a particular country (Chile) because it was being ruled by a left-of-centre government and, therefore, presumed not to be business-friendly.
The Doing Business project provides objective measures of business regulations and their enforcement across 190 economies and selected cities at the subnational and regional level.
The Doing Business project, launched in 2002, looks at domestic small and medium-size companies and measures the regulations applying to them through their life cycle.
By gathering and analyzing comprehensive quantitative data to compare business regulation environments across economies and over time, Doing Business encourages economies to compete towards more efficient regulation; offers measurable benchmarks for reform; and serves as a resource for academics, journalists, private sector researchers and others interested in the business climate of each economy.
Countries are scored (100=best) and ranked (1=best) for ‘ease of doing business’. The progenitors of DBR did not anticipate that the ranking exercise would become so influential. Timothy Besley calls it ‘…one of the most prominent knowledge products produced by the World Bank.’
Governments, especially in the developing world, eagerly consulted the annual publication of DBR to find out how well or how poorly they were ranked. When significant ‘improvements’ in the business environment took place, they led to the World Bank President (David Malpass) to join in the national celebrations, as in the case of Pakistan. He proclaimed: ‘Your country jumps to 108th place from 136th last year…I congratulate you all, prime minister, chief minister, your team for this achievement.’
In retrospect, this scramble to win the rankings game by many countries was a misguided endeavour that the World Bank made little or no attempt to rectify. Now, it seems, it has no choice. An official statement issued by the World Bank on August 27 acknowledges ‘data irregularities’ that were considered serious enough for the DBR to be ‘paused’. Here is an extensive extract from the August 27 statement.
A number of irregularities have been reported regarding changes to the data in the Doing Business 2018 and Doing Business 2020 reports, published in October 2017 and 2019…
The integrity and impartiality of our data and analysis is paramount and so we are immediately taking the following actions:
We are conducting a systematic review and assessment of data changes that occurred subsequent to the institutional data review process for the last five Doing Business reports.
We have asked the World Bank Group’s independent Internal Audit function to perform an audit of the processes for data collection and review for Doing Business and the controls to safeguard data integrity.
We will act based on the findings and will retrospectively correct the data of countries that were most affected by the irregularities.
The Board of Executive Directors of the World Bank has been briefed on the situation as have the authorities of the countries that were most affected by the data irregularities.
The publication of the Doing Business report will be paused as we conduct our assessment.
This embarrassing development was duly reported by leading representatives of the global media – see, for example, The Economist, Financial Times, Bloomberg Quint and Reuters, UK . All of them referred to Paul Romer’s concerns about DBR.
One wonders what Romer is thinking now. He also wanted to review past DBRs because he felt that changes in methods of measurement were too frequent and led to arbitrary changes in national rankings. He highlighted the case of Chile whose rank fell by more than twenty places in a short span of time.
It appears, however, that the worst fears of Romer have turned out to be true. It was not just a case of frequent changes in methodology, but ‘data irregularities’ that has caused the World Bank to temporarily cease the publication of DBR. Who committed these irregularities is unclear. The Bank faces the formidable challenge of salvaging the reputation of a flagship publication. Will it be able to persuade member states to take the DB rankings seriously following this debacle? Only time will tell.
COVID-19 has left its malevolent imprint on a global scale; it has also motivated multiple agencies and institutions to create and disseminate innovate datasets that have enabled the international community to make sense of the evolution of the current pandemic and policy responses to it. Some, such as Johns Hopkins University, have set the pace in tracking both morbidity and mortality across the world engendered by COVID-19. Others, such as the IMF and ILO, have compiled country-level responses to ameliorate the economic and social consequences of this persistent global contagion.
IMF has developed a ‘policy tracker’ that highlights monetary and fiscal policy actions undertaken by governments across the world. The dataset is primarily textual in nature.
ILO has created a global ‘monitor’ that seeks to capture the labour market consequences of COVID-19. The ‘monitor’ also collates government responses at the national level that aim to ameliorate such consequences.
Governments are taking a wide range of measures in response to the COVID-19 outbreak. This tool aims to track and compare policy responses around the world, rigorously and consistently.
I have delved into BSG’s diverse and rich dataset to illuminate (1) the overall stringency of government response (2) economic relief provided to business and the broader community based on the latest available data (September 9, 2020) as they prevail across the world.
One advantage of the the BSG dataset (officially known as ‘Oxford COVID-19 Government Response Tracker’ or OxCGRT) is that it aggregates diverse information into simple numerical indices. Like all COVID-19 related datasets that are currently available, OxCGRT is dynamic in nature and is updated with considerable frequency.
Shown below are a series of global maps that enable one to acquire a pictorial overview of country-level variations in government responses. In Map 1, one can detect the overall stringency of government response to COVID-19. This index is constructed from a variety of indicators, such as school and workplace closures. On a scale of 0-100 (100=strictest), countries generally vary from moderate (less than 50 as in Sri Lanka) to a high degree of stringency (above 70 as in parts of Australia).
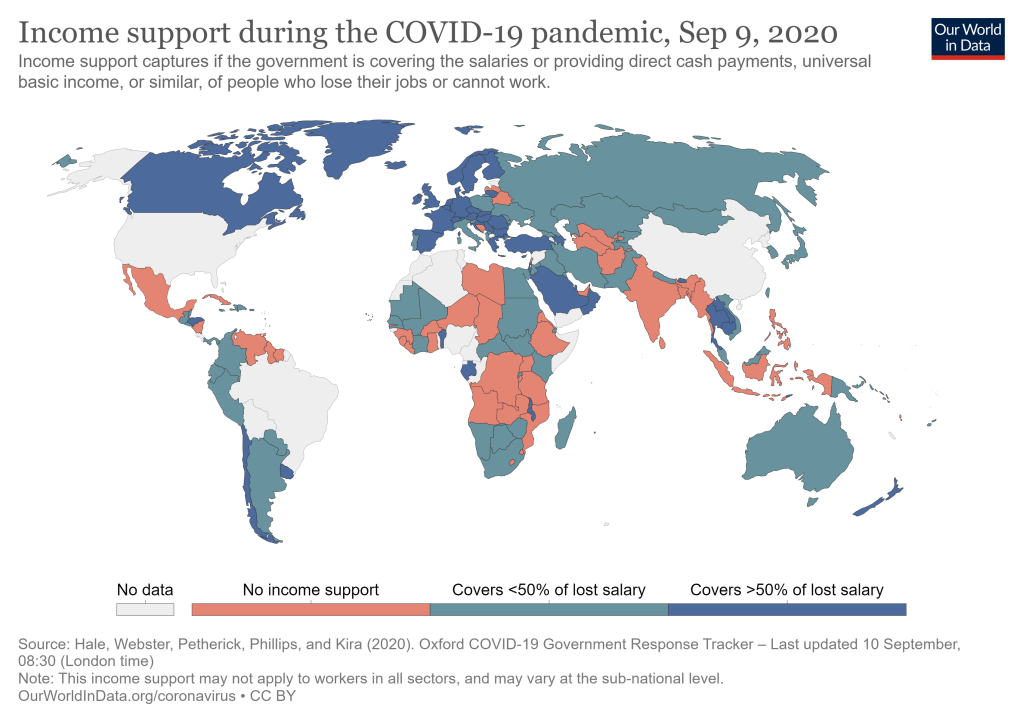
Maps 2 and 3 focus on economic relief to business and the broader community. Such measures take two forms: (a) income support to targeted groups (b) debt or contract relief in which financial obligations (such as loan repayments) are temporarily suspended. Once again, there are notable variations in the generosity of economic support that is provided. Canada, for example, provides generous income support (defined as replacement of more than 50 percent of lost salary), while Australia does not. There are quite a few countries, including India, where there is no income support. In general, countries seem to have juxtaposed broad-based debt or contract relief with modest income support.
It has to be noted that, despite the strenuous efforts by a truly global team at BSG to compile diverse information in a user-friendly way on as many countries as possible (186 at last count), there are conspicuous examples of countries (Brazil and China) on which there are, as yet, no data, at least in this ‘mapped’ version. This is a source of concern and will act as a hurdle in deepening our understanding of how governments across the world are seeking to ameliorate the grave economic and social consequences of the current global pandemic.
Finally, as the team at BSG makes it amply clear, describing how governments have responded is only the beginning of the critical enterprise to evaluate how effective such responses have been. BSG has no doubt inspired many to undertake that next step.