Afghanistan: then and now


Afghanistan is in the news these days as the Taliban, ousted from power following the US -led invasion in 2001, has returned to power after a surprisingly short-lived, but strikingly successful, military campaign against the incumbent government. Afghanistan’s future is uncertain as the memory of the Taliban’s brutal regime of religious dictatorship between 1996 and 2001 comes back to haunt the international community. There are widely shared fears that the reincarnated Taliban might simply be a recreation of murderous misdeeds of the past driven by religious zealotry.


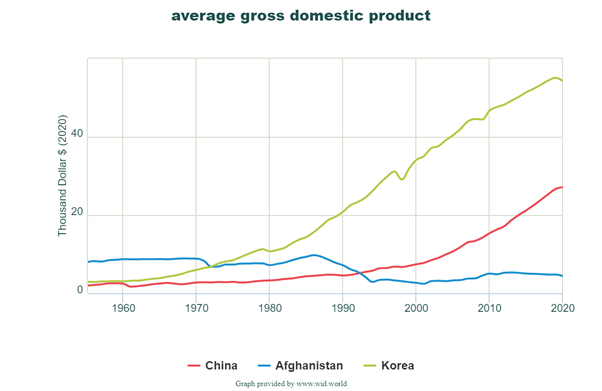
While reflecting on the future of Afghanistan, it would be worth noting that Afghanistan had a relatively prosperous and peaceful past, especially in the 1950s and 1960s. Indeed, some estimates of long-run per capita GDP suggest that Afghanistan in the 1950s and 1960s was richer than China and South Korea. Decades of conflict have rendered Afghanistan so poor that per capita GDP in 2020 was apparently lower than in 1950 (see Figure below).

Others have compiled a photo montage of Afghanistan of the ‘60s conjuring an era of a modern looking country. As Alan Taylor, writing in the Atlantic, notes wistfully:

In the 1950s and 1960s, some of the biggest strides were made toward a more liberal and westernized lifestyle, while trying to maintain a respect for more conservative factions. Though officially a neutral nation, Afghanistan was courted and influenced by the U.S. and Soviet Union during the Cold War, accepting Soviet machinery and weapons, and U.S. financial aid. This time was a brief, relatively peaceful era, when modern buildings were constructed in Kabul alongside older traditional mud structures, when burqas became optional for a time, and the country appeared to be on a path toward a more open, prosperous society. Progress was halted in the 1970s, as a series of bloody coups, invasions, and civil wars began, continuing to this day, reversing almost all of the steps toward modernization taken in the 50s and 60s.

Picture taken in 1962 at the Faculty of Medicine in Kabul of two Afghan medicine students listening to their professor (at right) as they examine a plaster cast showing a part of a human body. (Source: The Atlantic, July 2, 2013)

A panoramic view showing the old and new buildings in Kabul, in August of 1969. The Kabul River flows through the city, center right. In the background on the hilltop is the mausoleum of late King Mohammad Nadir Shah. (Source: The Atlantic, July 2, 2013)


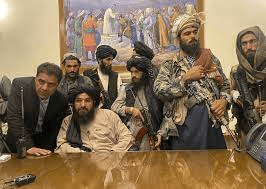
Contrast the seemingly idyllic pictures shown above with the one below as the Taliban insurgents occupy the Presidential palace in the wake of their triumphant return to Kabul. All we seem to have are armed mullahs projecting their invincibility to the rest of the world.

As one ponders the future of this conflict-ridden country which apparently had a peaceful and reasonably prosperous past, how should one respond to the claims of the US and its allies that Afghanistan in the post-2001 era went through a major phase of progress that is now likely to be reversed?

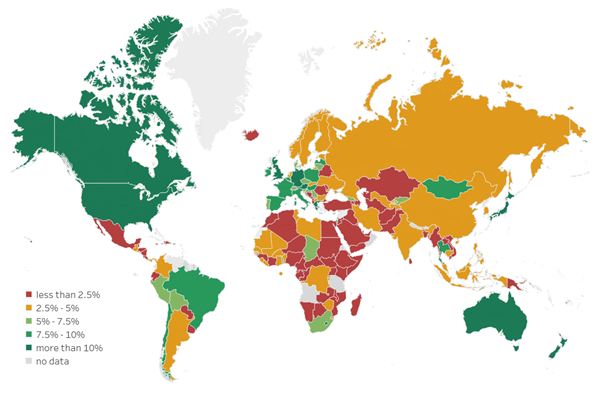
Was there significant progress? The per capita GDP figures shown above does not support that claim. A broader measure of well-being – the UNDP’s Human Development Index (HDI) – suggest some positive changes between 2000 and 2010 and a tapering off afterwards. Afghanistan has languished in the low human development category (HDI) for decades. Between 2014 and 2019, its international ranking (in terms of HDI) has slipped five places. Today, it is ranked 165th out of 189 countries.

Afghanistan: watch what you say

[Screengrab/Al Jazeera]

The Taliban, who have swept into power by ousting the US and NATO-supported Afghan government led by Ashraf Ghani, in an almost bloodless military campaign that lasted only a short period of time, are apparently fond of saying to foreign powers: ‘you have the watches, we have the time’. They waited 20 years, and now, they are back in power. Only time will tell whether Taliban 2021 will be any better than the brutal regime of 1996. Meanwhile, the US and its allies can only squirm at their optimistic assessments of Afghanistan’s political future. Here is a sample.

“The history of military conflict in Afghanistan [has] been one of initial success, followed by long years of floundering and ultimate failure. We’re not going to repeat that mistake.”

— President George W. Bush, in a speech at the Virginia Military Institute

April 17, 2002

Source: Craig Whitlock, Washington Post, December 9, 2019

“This army and this police force have been very, very effective in combat against the insurgents every single day. And I think that’s an important story to be told across the board.”

— Then-Army Lt. Gen. Mark A. Milley, praising the Afghan security forces during a press briefing from Kabul. Milley is now a four-star general and chairman of the Joint Chiefs of Staff.

September 4, 2013

Source: Craig Whitlock, Washington Post, December 9, 2019

President Biden, in response to a question by a journalist.

Q: Is a Taliban takeover of Afghanistan now inevitable?

THE PRESIDENT:  No, it is not.

Q    Why?

THE PRESIDENT:  Because … the Afghan troops have 300,000 well-equipped — as well-equipped as any army in the world — and an air force against something like 75,000 Taliban.  It is not inevitable.

The U.S. intelligence community concluded last week (in mid-June) that the government of Afghanistan could collapse as soon as six months after the American military withdrawal from the country is completed, according to officials with knowledge of the new assessment.

Source: The Wall Street Journal, June 23, 2021

Boris Johnson, the UK prime minister,  proclaimed: “there is no military path to victory for the Taliban” 

August 07 2021

Source: The Guardian

Happiness and Asian economies

Bhutan, a small, land-locked Asian country, became one of the first, if not the first, in the world to dethrone GDP and enshrine ‘Gross National Happiness’ as a core development goal. It played a pivotal role in the proclamation of UN resolution 66/281 at a meeting of the General Assembly in July 2012. As the UN notes:

The meeting was convened at an initiative of Bhutan, a country which recognized the supremacy of national happiness over national income since the early 1970s and famously adopted the goal of Gross National Happiness over Gross National Product.

The General Assembly of the United Nations in its resolution 66/281 of 12 July 2012 proclaimed 20 March the International Day of Happiness recognizing the relevance of happiness and well-being as universal goals and aspirations in the lives of human beings around the world and the importance of their recognition in public policy objectives.

Measures of happiness, based on so-called ‘life satisfaction’ surveys, usually rely on self-reported conditions of well-being. Hence, measures of happiness are invariably subjective, which is why they are often called measures of ‘subjective well-being’ (SWB).

This does not mean SWBs are unreliable. External validation of survey-based happiness estimates have found them to be reasonably accurate.

SWBs rely heavily on the Gallup surveys of citizens every year in more than 160 countries conducted in more than 140 languages. It is based on the notion of the ‘Cantril ladder’ or life ladder. It is derived from responses to the following question posed in the Gallup survey: “Please imagine a ladder, with steps numbered from 0 at the bottom to 10 at the top. The top of the ladder represents the best possible life for you and the bottom of the ladder represents the worst possible life for you. On which step of the ladder would you say you personally feel you stand at this time?”

The life ladder estimates enable countries to be scored and ranked on a scale of 0 (=worst) to 10 (= best). The country-specific scores and ranks are based on multi-year averages rather than one specific year. Figure 1 displays the 2021 country-specific scores for selected countries in the Asian region (where the scores are derived from 2018-2020 observations). The Asian countries are also compared with the global average for 2021 and the best performer for that year (Finland).

Figure 1


Source: Derived from World Happiness Report, 2021

There are several noteworthy features. Afghanistan is the worst performing country (2.52) not only in the Asian region but in the world at large. In general, the majority of Asian economies (20) in the sample reported here have a life ladder score ranging between 2.52 to 5.48 that place them below the global average (5.61) and far below the best performer (7.84) which is Finland. These estimates suggest that many Asian economies are ‘struggling’ (to use Gallup’s taxonomy) and, in at least two cases, ‘suffering’ (Afghanistan, India).

It is also noteworthy that at least three high income Asian economies – Hong Kong, South Korea and Japan – have scores below Uzbekistan which, according to World Bank classification  is a lower middle-income economy. These high-income Asian economies are the exception rather than the norm, as the top 20 economies in the world in terms of the happiness index reported here are usually high-income countries ranging from Finland (7.84, ranked 1) to Belgium (Belgium 6.83, ranked 20). One notable exception in this ‘top 20’ is Costa Rica which is classified as an upper middle-income country by the World Bank.

Policy makers in Asian economies that are worried about lack of happiness in their societies can draw on statistical exercises undertaken by the authors of the World Happiness Reports. What the statistical analyses show is that  income is only one determinant of life satisfaction that is, in turn, complement by multiple non-income variables. These include: (1) social support (that is a network of friends and relatives that one could draw on in times of personal distress (2) healthy life expectancy at birth (3) freedom to make life choices (4) generosity (share of those who donate to charitable activities (5) perceptions of corruption. The policy lesson is that a narrow focus on economic growth will not necessarily produce a happy society unless they are complemented by a focus on non-income dimensions that affect well-being. This multidimensional approach will acquire greater salience today, given COVID-19.

Bangladesh at 50: South Asia’s ‘standout star’?

Early this year, Bangladesh celebrated its 50th year as an independent nation. ‘The country was born’, writes Bloomberg columnist Mihir Sharma, ‘amid famine and war; millions fled to India or were killed by Pakistani soldiers’. At the time of its birth, Bangladesh was dismissed as a ‘basket case’, while superstars in the music profession scrambled to raise money to support aid programmes to assuage the suffering of a hungry, impoverished nation.

Today, Bangladesh is classified by the World Bank as a ‘lower middle income economy’ with notable progress in a broad range of social indicators. As the Economist noted nearly ten years ago, Bangladesh has come ‘out of the basket’.

What struck Sharma is that Bangladesh has quietly overtaken its once-richer South Asian neighbours – Pakistan and India. As he notes: ‘In 1971, Pakistan was 70% richer than Bangladesh; today, Bangladesh is 45% richer than Pakistan.’ Sharma reserves the strongest words of rebuke for India:

India — eternally confident about being the only South Asian economy that matters — now must grapple with the fact that it, too, is poorer than Bangladesh …Don’t hold your breath expecting India to acknowledge Bangladesh’s success: Right-wing figures in India are convinced Bangladesh is so destitute that illegal migrants from there are overrunning the border. In reality, Bangladesh is far richer than the depressed Indian states where Hindu nationalist politicians have been railing against Bangladeshi “termites.” It’s as if Mississippi were fretting about illegal immigration from Canada.

Ouch!

The Bangladesh government has recently announced that the country’s per capita GDP has risen to USD 2,227 thus consolidating its position as a lower middle income economy. This has happened despite the adverse shock of the current global pandemic because the country managed to maintain its rapid pace of growth. Indeed, from being a growth laggard relative to its powerful neighbours, Bangladesh has emerged as a growth leader. It did not even suffer a recession during the first wave of COVID-19 in 2020 – see the figure below culled from IMF DataMapper. The projections to 2025 suggest that Bangladesh will grow significantly faster than either India or Pakistan.

Figure 1: Comparative growth rates (%), 1980-2025, Bangladesh, India, Pakistan

Sharma attributes Bangladesh’s economic success to ‘exports, social progress and fiscal prudence’. These ‘three pillars’ are part of the story, but Sharma could have acknowledged that there is a rich literature trying to comprehend the ‘Bangladesh paradox’. How did an impoverished nation, dismissed as a basket case, and saddled with seemingly dysfunctional institutions and a corrupt, highly adverserial political system manage to get ‘out of the basket’?

Sharma, however, correctly notes that ‘Bangaldesh’s success brings its own set of problems’. He rightly opines that ‘(t)he government needs a strategy for the next decade that focuses on new forms of global integration and on a continued transformation of the economy’. This is a transition that ‘will test Bangladesh as it has …other nations’.

Coping with COVID-19: The ‘fiscal stimulus gap’ between rich and poor nations

Many countries across the world have undertaken unprecedented fiscal action to cope with the economic consequences of COVID-19. ILO has bemoaned the fact that the fiscal stimulus packages that have been enacted across the world have been rather unevenly distributed. The ILO’s Director General notes that the  “fiscal stimulus gap” is … around US$982 billion in low-income and lower-middle-income countries.’

The highly uneven nature of fiscal policy responses can be seen in Figure 1 below, with many countries in poorer parts of the world not being able to muster sufficient resources to cope with the pandemic-induced recession.


Figure 1 Global map of budgetary support (as % of 2020 GDP) in response to COVID-19 driven recession, derived from IMF Fiscal Monitor, April 2021

A clearer picture of this fiscal gap emerges when one examines Figures 2 to 4 (derived from IMF Fiscal Monitor, April, 2021).

Two types of fiscal measures are highlighted – type 1 or ‘above-the-line’  measures that consist of additional spending or forgone revenue; type 2 or ‘below-the-line’ measures that consist of liquidity support to the private sector in various forms – equity, loans on preferential terms and credit guarantees. Three broad cohorts are highlighted: (1) Advanced Economies (AEs, e.g., Japan); (2) Emerging market and middle-income economies (EMMIEs, e.g., Thailand); and (3) low income developing countries (LIDCs, e.g., Bangladesh).

The differences are quite stark. Consider the case of AEs. For this group, the average size of the fiscal support relative to GDP in terms of ‘above-the-line’ measures are over 16 percent and around 11 percent for ‘below-the-line’ measures.  It is worth observing that, among AEs, the USA has set the pace with its latest announcement of the fiscal stimulus package amounting to a staggering 25.5 percent of GDP! If successfully implemented, this package is likely to play a key role in shaping the growth and employment recovery in the USA, while delivering significant spill over benefits to the global economy.

For EMMIEs, the pertinent fiscal indicators drop to four per cent and below. For LIDCs, the relevant metrics are even lower –  around 1.6 percent of GDP for ‘above-the-line’ measures and about 0.2 percent for ‘below-the-line’ measures.

Figure 2: Fiscal policy response (% of GDP) in advanced economies (AEs)
Figure 3: Fiscal policy response (% of GDP), Emerging Market and Middle Income Economies (EMMIEs)
Figure 4: Fiscal policy response (% of GDP), Low Income Developing Countries (LIDCs).

To a significant extent, the fiscal stimulus gap between rich and poor nations reflect multiple structural constraints faced by low and middle income economies (LIMCs) that lead to limited fiscal space. Admittedly, a greater commitment to domestic resource mobilization and cutting back inefficiencies, corruption and waste can enlarge the fiscal envelope in LMICs, but it would be naive to suggest that such home-grown efforts alone are adequate. Without global cooperation and generous external assistance, the typical LMIC is likely to flounder and suffer perhaps irreversible setback in attaining the Sustainable Development Goals (SDGs). After all, about USD 3 trillion (equivalent to 2.6% of global GDP) would be required to meet the SDGs.

Furthermore, prevailing over COVID-19, which is a precondition for resumption of normal economic growth in the medium-term, requires a great deal of global cooperation in ensuring equitable access to mass vacccination programs. Sadly, such cooperation is yet to materialize.As one evaluation from Duke University notes:  ‘High-income countries currently hold a confirmed 4.6 billion doses, upper middle-income countries hold 1.5 billion doses, and lower middle-income countries hold 721 million doses, and low-income countries hold 770 million… Many high-income countries have hedged their bets by advance purchasing enough doses to vaccinate their population several times over.’  This troubling nature of ‘vaccine inequality’ means that many LMICs will not be able to prevail over COVID-19 within a reasonable timeframe thus preventing their capacity to resume normal economic activity. Hence, an equitable global vaccination programme is urgently needed to secure sustainable employment recovery across the world.