Mapping global responses to COVID-19: a view from Oxford

COVID-19 has left its malevolent imprint on a global scale; it has also motivated multiple agencies and institutions to create and disseminate innovate datasets that have enabled the international community to make sense of the evolution of the current pandemic and policy responses to it. Some, such as Johns Hopkins University, have set the pace in tracking both morbidity and mortality across the world engendered by COVID-19. Others, such as the IMF and ILO, have compiled country-level responses to ameliorate the economic and social consequences of this persistent global contagion.

IMF has developed a ‘policy tracker’ that highlights monetary and fiscal policy actions undertaken by governments across the world. The dataset is primarily textual in nature.

ILO has created a global ‘monitor’ that seeks to capture the labour market consequences of COVID-19. The ‘monitor’ also collates government responses at the national level that aim to ameliorate such consequences.

The Blavatnik School of Government (henceforth BSG) at the University of Oxford has created a comprehensive data analytic tool to highlight the fact that:

Governments are taking a wide range of measures in response to the COVID-19 outbreak. This tool aims to track and compare policy responses around the world, rigorously and consistently.

I have delved into BSG’s diverse and rich dataset to illuminate (1) the overall stringency of government response (2) economic relief provided to business and the broader community based on the latest available data (September 9, 2020) as they prevail across the world.

One advantage of the the BSG dataset (officially known as ‘Oxford COVID-19 Government Response Tracker’ or OxCGRT) is that it aggregates diverse information into simple numerical indices. Like all COVID-19 related datasets that are currently available, OxCGRT is dynamic in nature and is updated with considerable frequency.

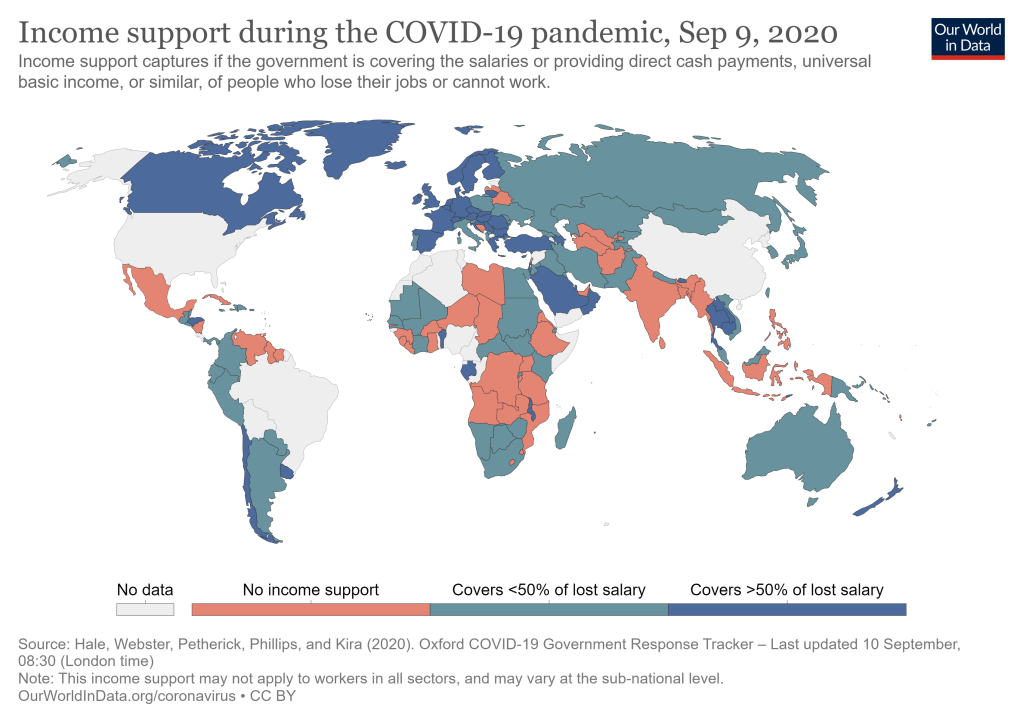
Shown below are a series of global maps that enable one to acquire a pictorial overview of country-level variations in government responses. In Map 1, one can detect the overall stringency of government response to COVID-19. This index is constructed from a variety of indicators, such as school and workplace closures. On a scale of 0-100 (100=strictest), countries generally vary from moderate (less than 50 as in Sri Lanka) to a high degree of stringency (above 70 as in parts of Australia).

Maps 2 and 3 focus on economic relief to business and the broader community. Such measures take two forms: (a) income support to targeted groups (b) debt or contract relief in which financial obligations (such as loan repayments) are temporarily suspended. Once again, there are notable variations in the generosity of economic support that is provided. Canada, for example, provides generous income support (defined as replacement of more than 50 percent of lost salary), while Australia does not. There are quite a few countries, including India, where there is no income support. In general, countries seem to have juxtaposed broad-based debt or contract relief with modest income support.

It has to be noted that, despite the strenuous efforts by a truly global team at BSG to compile diverse information in a user-friendly way on as many countries as possible (186 at last count), there are conspicuous examples of countries (Brazil and China) on which there are, as yet, no data, at least in this ‘mapped’ version. This is a source of concern and will act as a hurdle in deepening our understanding of how governments across the world are seeking to ameliorate the grave economic and social consequences of the current global pandemic.

Finally, as the team at BSG makes it amply clear, describing how governments have responded is only the beginning of the critical enterprise to evaluate how effective such responses have been. BSG has no doubt inspired many to undertake that next step.

MAPS OF THE WORLD ACCORDING TO BSG

Map 1
Map 2
Map 3

India in the wake of a pandemic-driven recession: massive loss, modest response?

India’s national statistical agency announced on August 31 that quarterly (April to June, 2020) GDP declined by a massive 23.9 percent. This was the largest recorded GDP contraction among major economies (see Figure 1). Thus, the Indian economy is heading towards an unavoidable recession for the FY 2020-21 which could surpass the severity of the five recessions that the nation has endured since Independence in 1947.

Figure 1: Quarterly GDP contraction, India vs the rest

Source for Figure 1: The Indian Express, September 2, 2020

The Finance Minister called the latest developments an ‘act of god’.

As she put it:

“This year we are facing an extraordinary situation… we are facing an act of God which might even result in a contraction of the economy, to what percent I am not getting into that.”

The tentative observation  ‘might even result in contraction’ became a harsh reality soon after the Honourable Minister spoke.

The country’s central bank (Reserve Bank of India: RBI) was fearing the worst when, a week prior to the August 31 release of the GDP figures, it noted:

“…high frequency indicators that have arrived so far point to a retrenchment in activity that is unprecedented in history”.

It also offered model-based estimates that the ‘output gap’ (actual GDP falling short of potential GDP) would be severe (-12 percent). To make matters worse, the RBI, in typically sedate and understated fashion, highlighted the fact that the economy was slowing down sharply well before the onset of COVID-19. Thus, it noted:

“…From Q1:2018-19, (the Indian economy) …lost speed continuously over the next 8 quarters, reaching 3.1 per cent in Q4:2019- 20, the lowest in the national accounts series…” (see Figure 2). Furthermore, it noted with disappointment that investment – a major engine of growth – was faltering well before COVID-19 descended with full force on India:

“A slowdown in fixed investment set in from 2011-12 and became entrenched from Q4:2018- 19, slumping into contraction from Q2:2019-20.”

Figure 2

Source for Figure 2: Scroll.in

The irony is that, despite a draconian nationwide lockdown regime, pursued over several weeks during March and April, there is little evidence that COVID-19 is under control in India (see Figure 3). As one economist lamented:

“The bleak data on the economy and the seemingly runaway COVID-19 pandemic point to serious shortcomings about the Indian government’s response”.

Figure 3

Source for Figure 3: Indian Express, September 2, 2020

So, what about the government’s response? The headline statistics, as embellished by the government in May 2020, revealed that the government was committed to spending an impressive 10 percent of GDP to cope with the adverse economic consequences of the current pandemic. The IMF, in its ‘Policy Tracker’ , suggests a mundane package of measures.

“India’s fiscal support measures can be divided into two broad categories: (i) direct spending (about 1.7 percent of GDP) and foregone or deferred revenue (about 0.3 percent of GDP falling due within the current year); and (ii) below-the-line measures designed to support businesses and shore up credit provision to several sectors (about 4.9 percent of GDP). The key direct-spending measures are: in-kind (food; cooking gas) and cash transfers to lower-income households; insurance coverage for workers in the healthcare sector; and wage support and employment provision to low-wage workers. An additional 150 billion rupees (about 0.1 percent of GDP) will be devoted to health infrastructure.” 

Is this enough? Not really, says an evaluation from Brookings Institution. The authors of this evaluation note:

“(The) funding responses and relief measures targeted at the poor and vulnerable…falls short as it mostly reallocates funding across existing budgets or allows people to make advance withdrawals on their social benefits rather than mobilizing additional funding. India needs to do more to help the families of low wage workers displaced from their jobs by the lockdown and the weakening economy.”

It remains to be seen whether, in light of the latest quarterly GDP figures, the government will come up with a more ambitious and comprehensive fiscal stimulus package to cope with the dire economic consequences of COVID-19.

Will Indonesia succumb to a secular growth slow-down? If so, does it matter?

In an iconoclastic paper, Lant Pritchett and Larry Summers (2015), question the standard view that emerging economies in the Asian region that are currently growing rapidly are expected to do so for the next decade and beyond. The authors call this a case of ‘Asiaphoria’. Yet, they argue, an enduring feature of growth statistics is that there is ‘regression to the mean’, that is, over time even rapidly growing economies converge to mean rates that lie between two and four percent.  Hence, ‘abnormally rapid growth’ does not last too long. As countries grow richer, their growth rates slow down. One can also call this a case of secular growth slow-down. Summers and Pritchett argue that the most popular case of Asiaphoria is represented by China. Yet, China is not immune to the phenomenon of a secular growth slow-down – see Figure 1 below.

Figure 1

Source: Pritchett and Summers (2015)

What about other Asian economies, such as Indonesia? It had the misfortune of suffering from a historically unprecedented double-digit recession in the wake of the 1997-1998 Asian Financial Crisis. This was followed by decades of solid growth of just over 5 percent.

Despite such impressive achievements , there is a yearning among policymakers to grow at an even faster rate that is at par with the rapid growth era of the Suharto regime when, between 1980-1996, the economy grew at an average rate of seven percent. This aspiration is one of the reasons behind the current push for comprehensive structural and regulatory reforms. The expectation is that such reforms will allow the replication of the golden period of growth of the 1980s and mid-1990s – or at least a growth rate in the six percent range.

Figures 2 and 3 depict the average long run growth rate of Indonesia (5.5 percent) – measured over four decades – relative to seven selected economies from ASEAN and OECD and adds a new metric: the number of recessions per country over forty years. Indonesia’s long-run growth performance is commendable relative to regional and OECD norms. It is noteworthy that Indonesia had fewer recessions (two) than the selected OECD economies (five to seven) and some ASEAN economies (three).

Derived from IMF DataMapper

Derived from IMF DataMapper

The key issue is whether it is reasonable to expect that Indonesia should aspire to grow at even faster rates – six percent seems to be one of the aspirations – for the next decade and beyond.

Will Indonesia succumb to a secular growth slow-down? If so, does it matter? Figure 4, derived from long-run projections by the OECD (2018), suggest that aggregate growth rate will decline by one percentage point between now and 2030 – thus corroborating the notion of a (partial) regression to the mean.

Source: Derived from OECD (2018)

Optimists suggest that it is possible to avoid the phenomenon of secular growth slow-down by adopting an ambitious agenda of structural and regulatory reforms cutting across governance and education. In the case of Indonesia, such reforms are projected to increase the aggregate growth to a moderate degree – but not to the six percent threshold. It is, however, reassuring to note that, even in the case of a ‘business-as-usual’ scenario, Indonesia’s per capita GDP is expected to increase from 30.5 percent of OECD-wide per capita GDP to 48 percent by 2045 . At that point, Indonesia will be celebrating its 100th year as a sovereign nation.

This terse, but important, discourse on secular growth slow-down implies that one should avoid the temptation to succumb to ‘Asiaphoria’. The emphasis should be on the quality of growth rather than its quantity. This, in turn, entails an understanding of the employment and social dividends that accrue at a given rate of growth and how to enhance such dividends with an appropriate mix of policies.

How hard will the Indonesian economy be hit by the current pandemic?

Indonesia rose from the ruins of the 1997-1998 financial crisis in a commendable fashion. Economic recovery from a historically unprecedented double-digit recession was followed by decades of solid growth of just over 5 per cent (Figure 1) . This led to more than doubling of per capita GDP between 1998 (the nadir of the Asian Financial Crisis) and 2019 (Figure 2). Furthermore, Indonesia managed to consolidate democratic and decentralized governance in a country with an entrenched tradition of an authoritarian and centralized political system.

As data from the national statistical agency (BPS) show, poverty has come down significantly over the last decade and is now below 10 percent based on a national poverty line. Unemployment too has come down from double digits to a little over 5 per cent. Of course, there are persistent labour market challenges: a high degree of informality, a significant proportion of the population at risk of poverty, more than 20 percent of young Indonesians who are not in employment, education or training (NEET), and persistent gender disparities. Despite these challenges, one cannot overlook Indonesia’s achievements after the 1997/1998 Asian financial crisis.

Source IMF datamapper

The pernicious influence of the current global pandemic – COVID-19 – has not escaped Indonesia. It has affected both lives and livelihoods and is threatening the country’s sustained increase in living standards. So far, there has been more than 100,000 cases and nearly 5,000 deaths (Johns Hopkins University as at July 30).

The GDP growth projections for 2020 are universally negative, ranging from moderate to severe (Figure 3). This is the result of mobility restrictions and partial lockdowns to contain the pandemic with their inevitable dampening effect on economic activity.

It is worth noting that even the most pessimistic projection does not come close to the double digit recession of the late 1990s. Still, like many nations today, Indonesia faces an uncertain future as it seeks to cope with the malevolent consequences of the current global pandemic.

Alternative growth projections for Indonesia – ADB, IMF, OECD, World Bank. OECD has two scenarios: (a) pandemic is time-bound with a ‘single hit’; (b) pandemic has a second wave and economy suffers a ‘double hit’
Source: World Bank

How the great Indian lockdown became the great Indian ‘policy disaster’

Source: https://www.sciencemag.org/news/2020/05/india-s-lockdown-ends-exodus-cities-risks-spreading-covid-19-far-and-wide

Among countries fighting to stave off COVID-19, India became known as the world’s largest and the most stringently imposed lockdown, with the Modi government giving barely four hours’ notice to residents and citizens before the shutters went up on March 24. The lockdown, after multiple extensions, lasted for several weeks. Yet, today, India is ranked as the third most affected country in the world (as depicted by Johns Hopkins University) in terms of total confirmed cases (although, when adjusted for population size, it has a better ranking). In terms of number of deaths too, it does not fare well relative to many of its peers.  

What happened? How did the great Indian lockdown fail to produce the expected outcomes? It appears that, instead of ‘flattening’ the pandemic curve, the lockdown strategy merely delayed it for a while.

Table 1 Confirmed Cases by Country/Region/Sovereignty – the top ten

3,711,359 US
2,074,860 Brazil
1,038,716 India
764,215 Russia
350,879 South Africa
349,500 Peru
338,913 Mexico
328,846 Chile
295,632 United Kingdom
271,606 Iran

This is what Kaushik Basu , noted Indian economist (former Chief Economic Adviser to the Indian government and former Chief Economist of the World Bank) says:

The lockdown, announced on March 24, far from controlling the spread of the pandemic, seems to have made it worse. Two weeks after the start of the lockdown, the infection rate picked up and it has been on an alarming upward climb since then (See Figure below)

There is apparently more bad news on the pandemic front. Media reports in India highlight the following disturbing prospects:

A study by researchers from the Massachusetts Institute of Technology (MIT) that stated that the number of Covid-19 cases recorded per day in India may surge to 287,000 by early 2021 if a vaccine or treatment isn’t developed soon. In fact, India may record the highest number of fresh cases in the world by the end of winter in 2021, according to this study.

Basu notes that:

There was a natural expectation that the government had plans of how to handle the sudden stoppage of work and movement of people, and the break in supply chains. But there was no evidence of any of these ancillary actions. I do not have enough information to know what plans there were, but the total absence of any supporting action, to ramp up testing, expand the medical sector and to help the millions of stranded poor workers, was baffling. It was almost as though some people in government — bureaucrats and even some politicians who are part of this government — had decided to sabotage the Prime Minister’s lockdown by sitting back and doing nothing.

Perhaps the worst aspect of the lockdown was the immense suffering caused to hundreds of thousands of poor migrant workers. Deprived of livelihoods that are typically based on daily wages, these poor and vulnerable migrant fled – or at least tried to do so – the cities to seek sanctuary in their villages. Huddled together as they travelled to their destinations, these migrant workers paradoxically became a potent source of new rounds of infection.

What has happened, Basu concludes, is a ‘policy disaster’. The economy is spiralling down while the pandemic is spiralling up. IMF forecasts suggest that the Indian economy will contract by -4.5% before recovering in 2021. This is the worst such contraction since 1980. Estimates of monthly unemployment rates suggest that it shot up to a staggering 23.5% in May before coming down to 11.0% in June 2020 – a historical high. The incidence of extreme poverty is likely to go up by 100 million, reversing sustained reductions in poverty over past decades.

India’s experience is a cautionary tale on how simply implementing a lockdown – however ambitious and stringent – is not enough to cope with a pandemic. Crucial supporting actions are required that can balance the risks of lost lives with that of lost livelihoods.